Part 1 of 3 in the Java Performance Optimization series. Parts 2 and 3 coming soon.
I built a Java order-processing app for a talk I gave at DevNexus a couple of weeks ago. The app worked. Tests passed. I ran a load test and collected a Java Flight Recording (JFR).
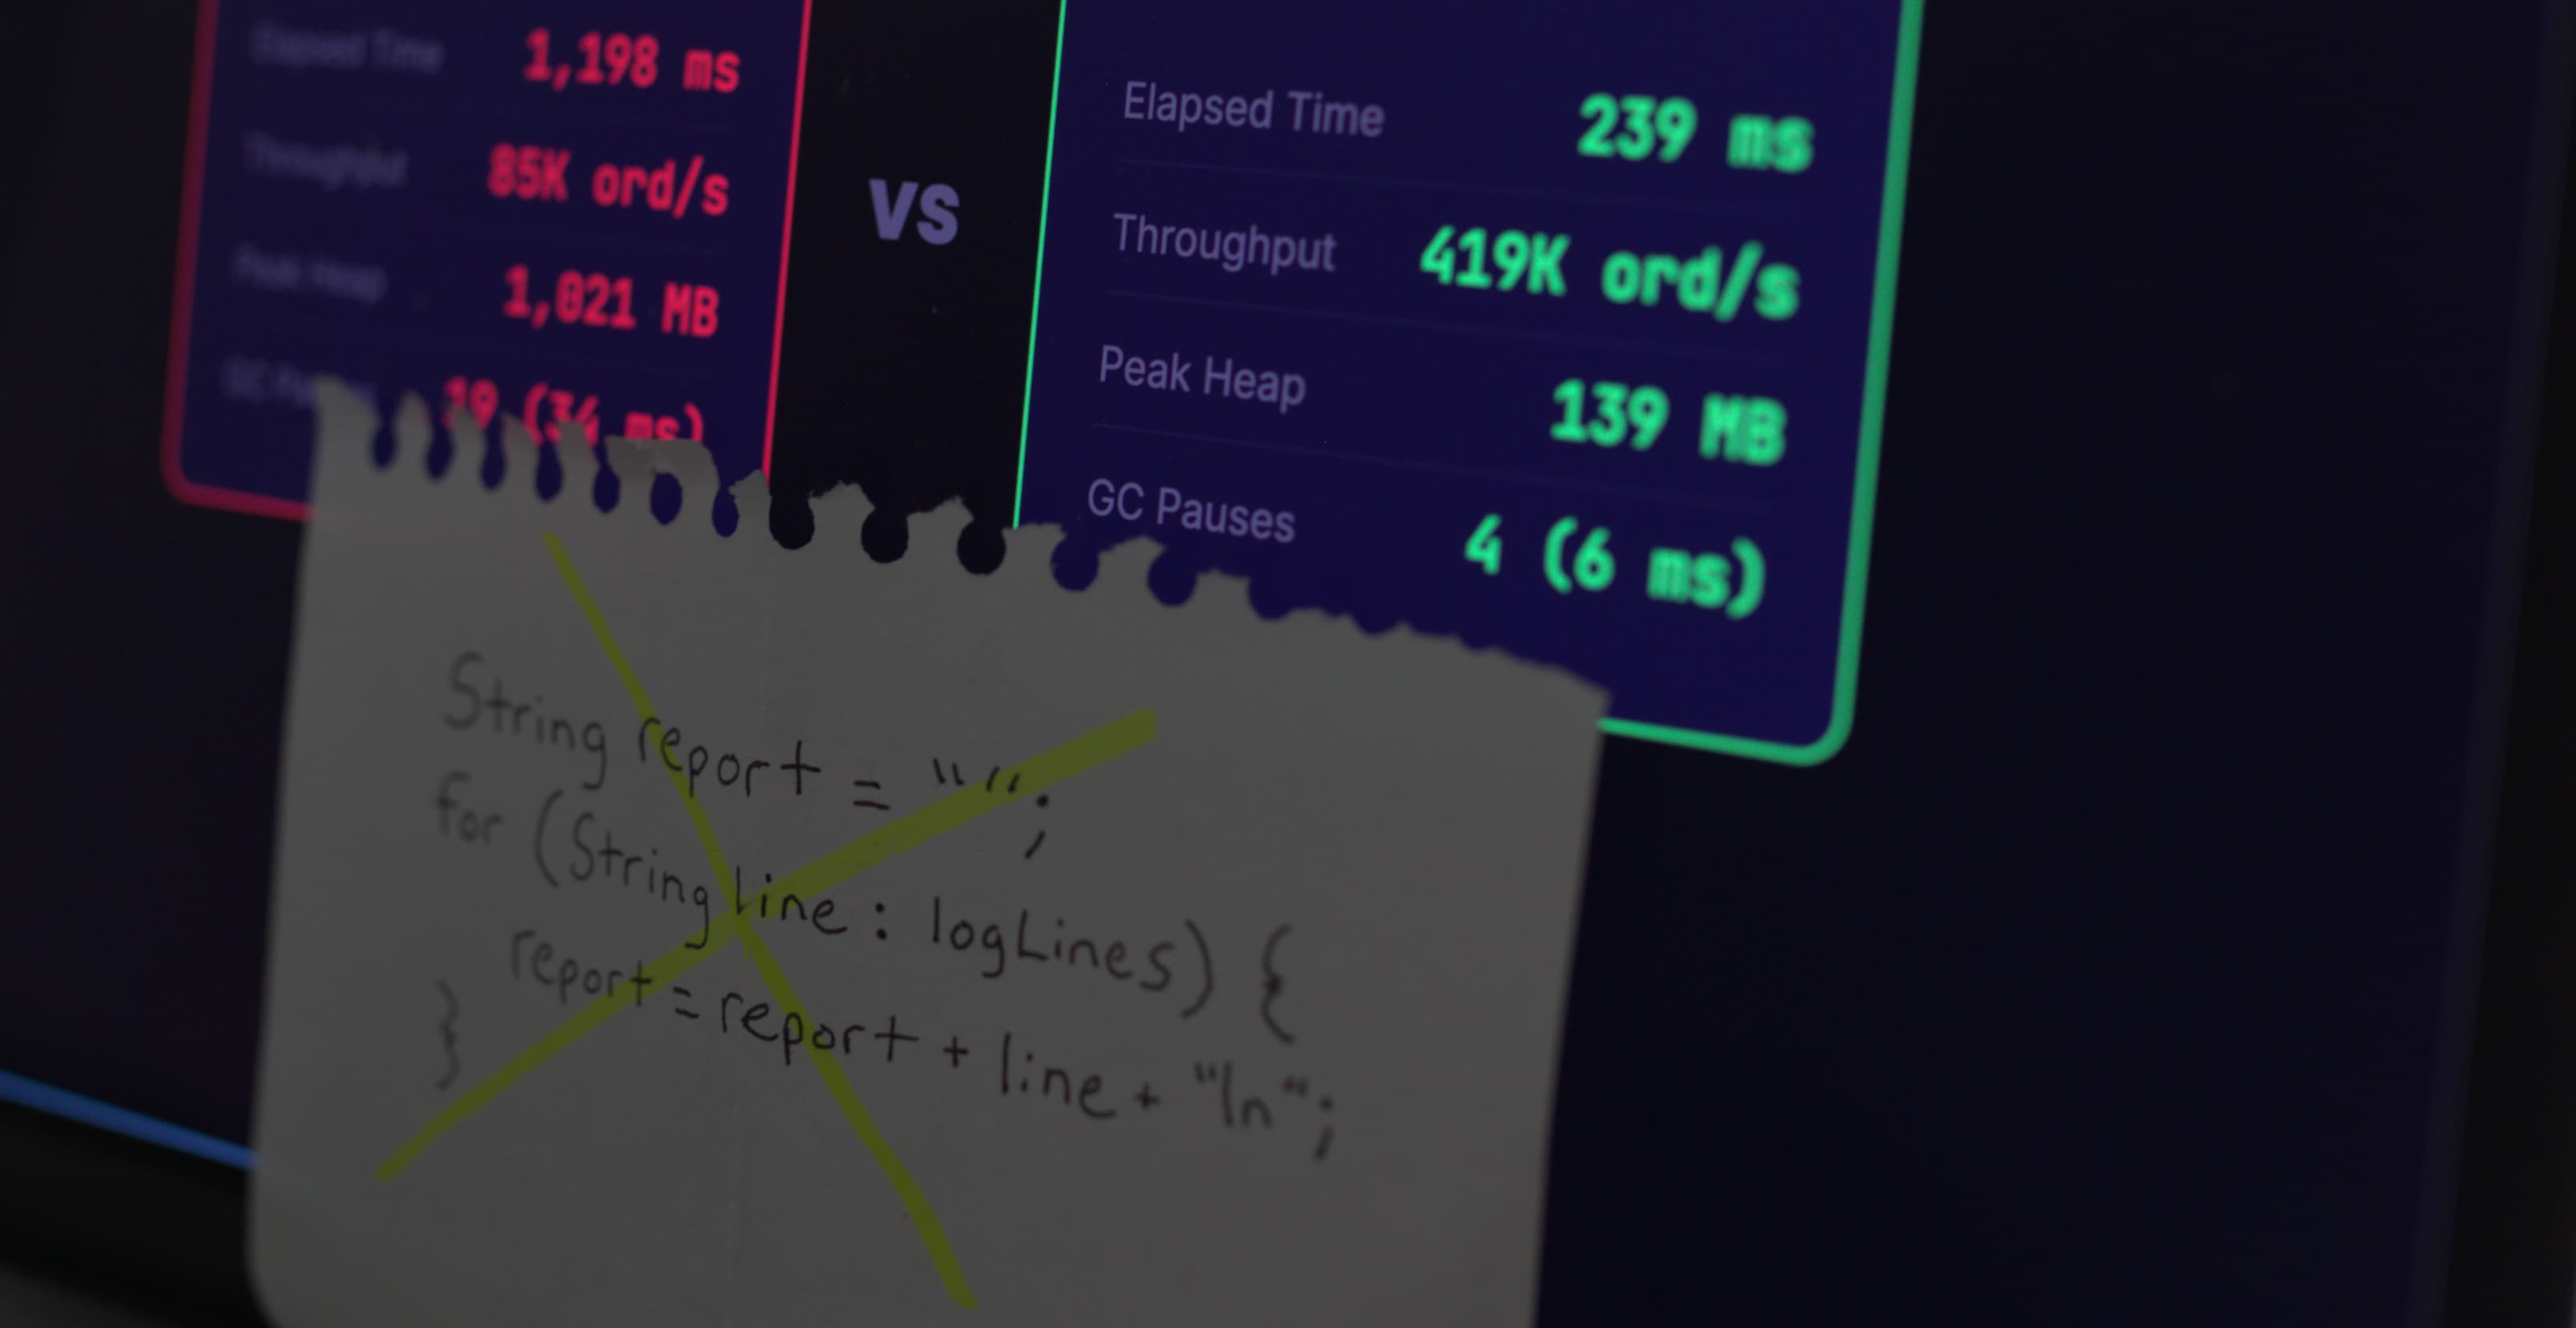
Before any changes: 1,198ms elapsed time, 85,000 orders per second, peak heap sitting at just over 1GB, 19 GC pauses.
After: 239ms. 419,000 orders per second. 139MB heap. 4 GC pauses.
Same app. Same tests. Same JDK. No architectural changes. And those numbers get a lot more meaningful when you consider that code like this doesn’t run on a single box in production. It runs across a fleet.
In Part 2 I’ll walk through the profiling data behind those numbers: the flame graph, which methods were actually hot, and what changed when we fixed them. Before we get there, you need to know what kinds of things we were actually fixing.
The problems were patterns that show up in real codebases. They compile fine, they sneak through code review, and they’re the kind of thing you could miss without profiling data telling you where to look. Here are eight of them.
TL;DR: Fixing anti-patterns like these turned a Java app that took 1,198ms into one that took 239ms. Here are some to look for and fix:
- String concatenation in loops — O(n²) copying from immutability
- O(n²) stream iteration inside loops — streaming the full list per element
- String.format() in hot paths — slowest string builder, parses format every call
- Autoboxing in hot paths — millions of throwaway wrapper objects
- Exceptions for control flow — fillInStackTrace() walks the entire call stack
- Too-broad synchronization — one lock becomes the bottleneck
- Recreating reusable objects — ObjectMapper, DateTimeFormatter, Gson per call
- Virtual thread pinning (JDK 21–23) — synchronized + blocking I/O pins carriers
After fixing: 5x throughput, 87% less heap, 79% fewer GC pauses. Same app, same tests, same JDK.
1. String Concatenation in Loops
String report = "";
for (String line : logLines) {
    report = report + line + "\n";
}
This code looks good, right? The problem is what String immutability means in practice.
Every time you use +, Java creates a brand new String object, a full copy of all previous content with the new bit appended. The old one gets discarded. This happens every single iteration.
The characters being copied scale as O(n²). If you have 10,000 lines, iteration 1 copies roughly nothing, iteration 5,000 copies 5,000 characters worth of accumulated content, iteration 10,000 copies all of it. BellSoft ran JMH benchmarks on exactly this and showed that when n grows by 4x, the loop-concatenation version slows down by more than 7x, much worse than linear growth.
The fix:
StringBuilder sb = new StringBuilder();
for (String line : logLines) {
    sb.append(line).append("\n");
}
String report = sb.toString();
StringBuilder works off a single mutable character buffer. One allocation. Every append writes into that buffer. One toString() at the end.
Note: Since JDK 9, the compiler is smart enough to optimize "Order: " + id + " total: " + amount on a single line. But that optimization doesn’t carry into loops. Inside a loop, you still get a new StringBuilder created and thrown away on every iteration. You have to declare it before the loop yourself, like the fix above shows.
2. Accidental O(n²) with Streams Inside Loops
for (Order order : orders) {
    int hour = order.timestamp().atZone(ZoneId.systemDefault()).getHour();
    long countForHour = orders.stream()
        .filter(o -> o.timestamp().atZone(ZoneId.systemDefault()).getHour() == hour)
        .count();
    ordersByHour.put(hour, countForHour);
}
This looks reasonable. You’re grouping orders by hour. But look at what’s happening: for each order, you’re streaming over the entire list to count how many orders share that hour. If you have 10,000 orders, that’s 10,000 iterations times 10,000 stream elements. That’s 100 million comparisons for what should be a single pass.
In my demo app, this exact pattern was the single largest CPU hotspot. It accounted for nearly 71% of CPU stack samples in the JFR recording.
The fix:
for (Order order : orders) {
    int hour = order.timestamp().atZone(ZoneId.systemDefault()).getHour();
    ordersByHour.merge(hour, 1L, Long::sum);
}
One pass. O(n). Each order increments its hour’s count directly. You could also use Collectors.groupingBy(... Collectors.counting()) to do it in a single stream pipeline, but the merge approach is clear and avoids the overhead of creating a stream at all.
If you see a .stream() call inside a loop body, that’s a signal to pause and check whether you’re doing redundant work.
3. String.format() in Hot Paths
public String buildOrderSummary(String orderId, String customer, double amount) {
    return String.format("Order %s for %s: $%.2f", orderId, customer, amount);
}
String.format() tends to get recommended as the clean, readable way to build strings. Yep, it’s readable and it’s also the slowest string-building option in Java when you’re calling it frequently.
Baeldung ran JMH benchmarks across every string concatenation approach in Java. String.format() came in last in every category. It has to parse the format string every call, run regex-based token matching, and dispatch through the full java.util.Formatter machinery. StringBuilder was consistently the fastest.
The fix:
return "Order " + orderId + " for " + customer + ": $" + String.format("%.2f", amount);Use String.format() for the numeric formatting where you need it, and let the compiler optimize the rest. Or just use a StringBuilder if you need full control.
String.format() is fine for config loading, startup code, error messages, anywhere that runs infrequently. Move it out of anything your profiler says is hot.
4. Autoboxing in Hot Paths
Long sum = 0L;
for (Long value : values) {
    sum += value;
}
What’s actually happening at the JVM level:
Long sum = Long.valueOf(0L);
for (Long value : values) {
    sum = Long.valueOf(sum.longValue() + value.longValue());
}
Each iteration unboxes sum to get a long, adds, then boxes the result back into a new Long object. With a million elements, you’ve created a million Long objects that the GC has to clean up. Each Long on a 64-bit JVM takes roughly 16 bytes on the heap. That’s 16MB of heap churn for what should be a simple addition loop.
long sum = 0L;  // primitive, not the wrapper
for (long value : values) {
    sum += value;
}
Where this tends to sneak in: aggregation and processing loops. Summing metrics, accumulating counters, building stats. Boxed types creep in because someone used Long in a collection signature somewhere upstream and nobody thought about what it costs downstream in the loop. That can be legitimately easy to miss.
Watch for Integer, Long, or Double used as local loop variables or accumulators. Also watch for List<Long> and Map<String, Integer> in frequently-called code. Every .get() and .put() involves a box/unbox round trip that you’re paying for silently.
5. Exceptions for Control Flow
public int parseOrDefault(String value, int defaultValue) {
    try {
        return Integer.parseInt(value);
    } catch (NumberFormatException e) {
        return defaultValue;
    }
}
If this method is called in a tight loop with a meaningful percentage of non-numeric inputs, you have a performance problem that might not look like one.
The expensive part is Throwable.fillInStackTrace(), which runs inside the Throwable constructor every time an exception is created. It walks the entire call stack via a native method and materializes it into StackTraceElement objects. The deeper your call stack, the more expensive this is. Imagine a situation in a framework like Spring where this can get very deep. Norman Maurer from the Netty project benchmarked this and the difference is significant. Baeldung’s JMH results show that throwing an exception makes a method run hundreds of times slower than a normal return path.
This isn’t theoretical. There’s a real production story of a Scala/JVM templating system that cut response time by 3x after discovering that a NumberFormatException was being thrown on every field of every template render. Every time a field name was being tested to see if it was a numeric index, it threw.
The fix:
public int parseOrDefault(String value, int defaultValue) {
    if (value == null || value.isBlank()) return defaultValue;
    for (int i = 0; i < value.length(); i++) {
        char c = value.charAt(i);
        if (i == 0 && c == '-') continue;
        if (!Character.isDigit(c)) return defaultValue;
    }
    return Integer.parseInt(value);
}
Or use NumberUtils.isParsable() from Apache Commons Lang if it’s already on your classpath.
The principle: if invalid input is a routine case in your application, user-provided data, external feeds, anything you don’t fully control, pre-validate explicitly. Exceptions are for genuinely unexpected conditions, not for “this might be in the wrong format.”
6. Too-Broad Synchronization
public class MetricsCollector {
    private final Map<String, Long> counts = new HashMap<>();

    public synchronized void increment(String key) {
        counts.merge(key, 1L, Long::sum);
    }

    public synchronized long getCount(String key) {
        return counts.getOrDefault(key, 0L);
    }
}
Shared mutable state needs protection. But synchronized on the whole method means only one thread can call either method at any given time. In a service handling real concurrency, every thread calling increment() queues up waiting for every other thread to finish. The lock itself becomes the bottleneck.
The fix:
private final ConcurrentHashMap<String, LongAdder> counts = new ConcurrentHashMap<>();

public void increment(String key) {
    counts.computeIfAbsent(key, k -> new LongAdder()).increment();
}

public long getCount(String key) {
    LongAdder adder = counts.get(key);
    return adder == null ? 0L : adder.sum();
}
ConcurrentHashMap handles concurrent reads and writes without locking the whole structure. LongAdder is purpose-built for high-concurrency incrementing. It distributes the counter across internal cells and outperforms AtomicLong under contention.
Worth calling out separately: Collections.synchronizedMap() wrappers have the same broad-lock problem, one lock for the entire map. ConcurrentHashMap is almost always the right replacement.
7. Repeated Creation of “Reusable” Objects
public String serializeOrder(Order order) throws JsonProcessingException {
    return new ObjectMapper().writeValueAsString(order);
}
ObjectMapper is one of the most common examples of an object that looks cheap to create but isn’t. Constructing one involves module discovery, serializer cache initialization, and configuration loading. It’s real work happening on every call here.
Same pattern with DateTimeFormatter.ofPattern("..."), new Gson(), new XmlMapper(). They’re all designed to be constructed once and reused. Creating them in a hot method means paying that setup cost on every invocation.
The fix:
private static final ObjectMapper MAPPER = new ObjectMapper();

public String serializeOrder(Order order) throws JsonProcessingException {
    return MAPPER.writeValueAsString(order);
}
ObjectMapper is thread-safe once configured, so sharing a static final instance is fine. The DateTimeFormatter built-ins like DateTimeFormatter.ISO_LOCAL_DATE are already singletons. If you’re calling DateTimeFormatter.ofPattern("...") in a hot method, move it to a constant.
The heuristic: if an object’s constructor does substantial setup work and the object is stateless (or safely shareable) after construction, it should be a field or a constant, not a local variable.
8. Virtual Thread Pinning (If You’re on JDK 21–23)
This one is worth including if you’ve started using virtual threads, introduced as a production feature in Java 21.
Virtual threads work by mounting onto a small pool of platform (OS) threads called carrier threads. When a virtual thread blocks, waiting on I/O for example, the scheduler unmounts it from the carrier, freeing that carrier to run something else. That’s the whole scalability story with virtual threads.
But there’s a catch. When a virtual thread enters a synchronized block and hits a blocking operation while inside it, it can’t be unmounted. It pins the carrier thread. That platform thread is now stuck waiting, unable to serve other virtual threads, for as long as the blocking operation takes.
// This pattern can pin a carrier thread on JDK 21
public synchronized String fetchData(String key) throws IOException {
    return Files.readString(Path.of("/data/" + key)); // blocking I/O inside synchronized
}
If this happens frequently enough, all your carrier threads get pinned and your application stalls, even with thousands of virtual threads waiting to do work. Netflix ran into exactly this in production and wrote a post about debugging it.
JFR actually tells you when this is happening. The jdk.VirtualThreadPinned event fires whenever a virtual thread blocks while pinned, and by default it only triggers when the operation takes longer than 20ms, so it’s already filtered to the cases that actually matter.
The fix on JDK 21–23:
private final ReentrantLock lock = new ReentrantLock();

public String fetchData(String key) throws IOException {
    lock.lock();
    try {
        return Files.readString(Path.of("/data/" + key));
    } finally {
        lock.unlock();
    }
}
ReentrantLock doesn’t use OS-level object monitors, so the JVM can unmount the virtual thread normally when it blocks, instead of pinning it to the carrier.
JDK 24 note: JEP 491, shipped in Java 24, largely resolves this. synchronized no longer causes pinning in most cases on JDK 24+. If you’re still on 21, 22, or 23, this is still relevant and worth checking for with JFR. If you’re on 24, you mostly don’t have to worry about it for synchronized, though native method calls can still cause pinning.
The Compounding Effect
None of these patterns crash your application. They don’t throw exceptions or produce wrong answers. They just make everything a bit slower, chew through more memory, and scale worse than they should.
What makes them hard to find without profiling is that any one of them might be completely harmless in your codebase. String concatenation in a loop that runs once at startup costs you nothing. String.format() in a utility class called twice a day is fine. The issue is when these patterns land in hot paths, code that runs on every request, every event, every iteration of your main processing loop.
In my demo app, patterns like these and others turned a 239ms operation into a 1,198ms one and pushed heap usage from 139MB to over 1GB. No single pattern was catastrophic in isolation. But fix the heap pressure and GC pauses dropped from 19 to 4. Fix the contention and now new hotspots become visible that were previously buried under the noise. The shape of the profile shifts.
And these improvements compound again beyond a single application. Some of these optimizations might seem trivial when you’re looking at a single instance or seeing small improvements in your test suite run time. But often real world Java code doesn’t run on one box. In production, there are apps that run across a fleet handling a large volume of real customer requests. An improvement that shaves a few milliseconds or reduces heap pressure on one host is happening across thousands of hosts simultaneously. At that scale, the aggregate difference is incredible. Cost impact can be significant when you consider throughput improvements and potential instance downsizing across a fleet.
That cascading effect is what I want to show in Part 2, directly in JDK Mission Control. You’ll see the flame graph before any changes, then what it looks like after the first round of fixes, and how the picture keeps changing. In Part 3, we’ll look at automating the process of identifying and implementing performance improvements.
If any of these look familiar, wait until you see what the flame graph looks like. I’m on LinkedIn. Part 2 coming soon: One Method Was Using 71% of CPU. Here’s the Flame Graph.